ລາຍລະອຽດ
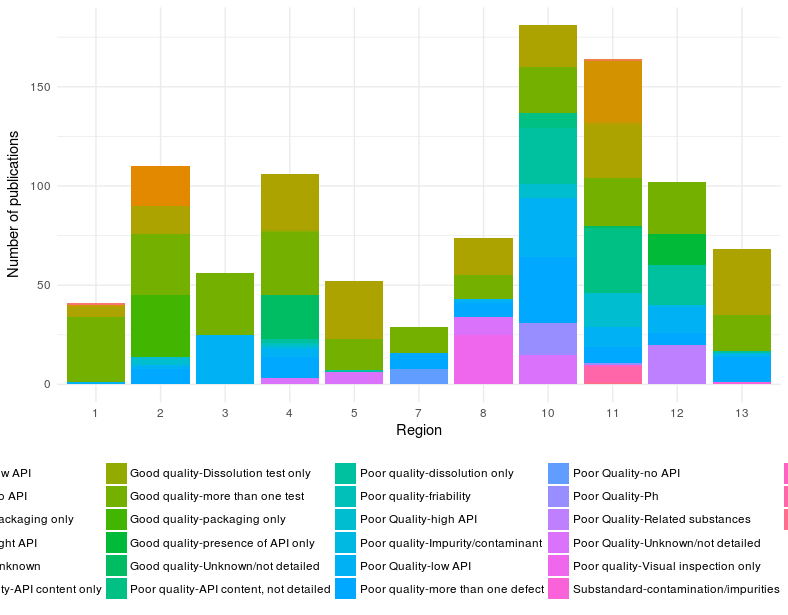
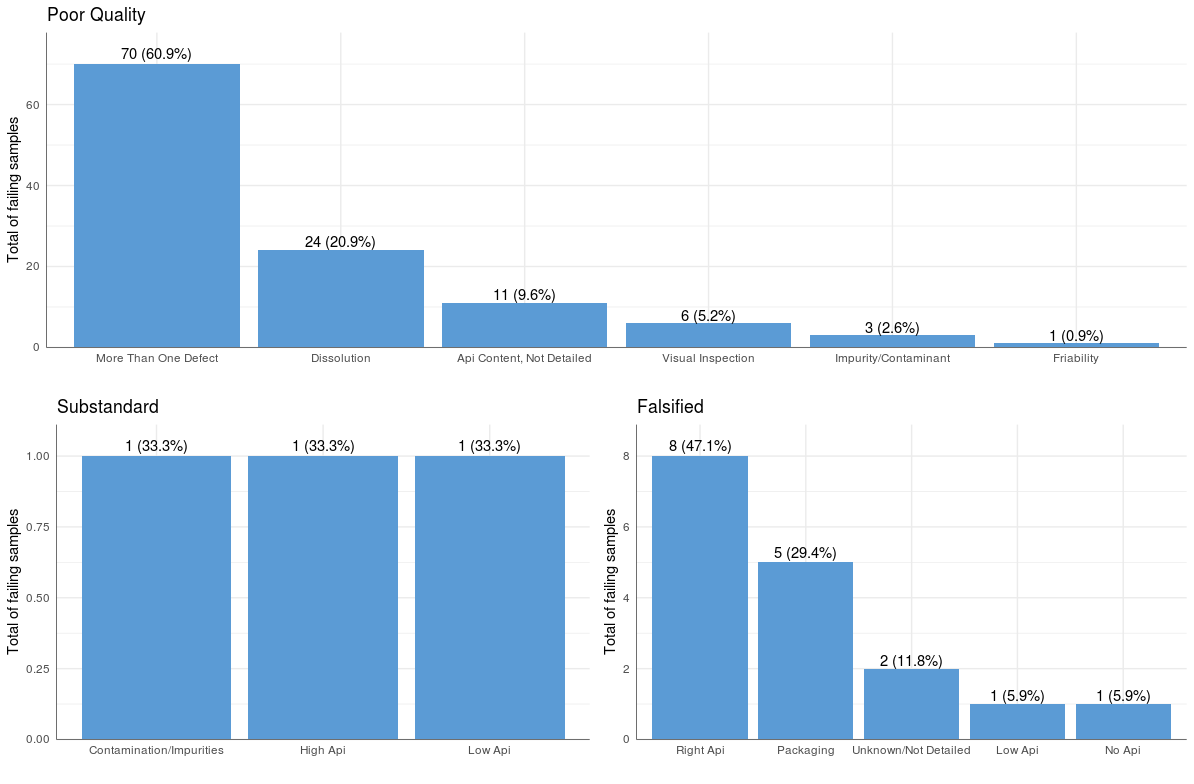
The client, a research center studying medicine quality, has a database where they input data from their watch on publications related to medicine quality. They needed to produce graphs on specific medicine for a research article.
ເຕັກໂນໂລຊີ
Extraction of data from MySQL database.
Charts creation with R.
ວຽກງານຂອງພວກເຮົາ
I had to understand the structure of the database and then write the SQL requests corresponding to the graphs they wanted to create.
From those requests, I used R to generate graphs.
ໄລຍະເວລາ
November 2018